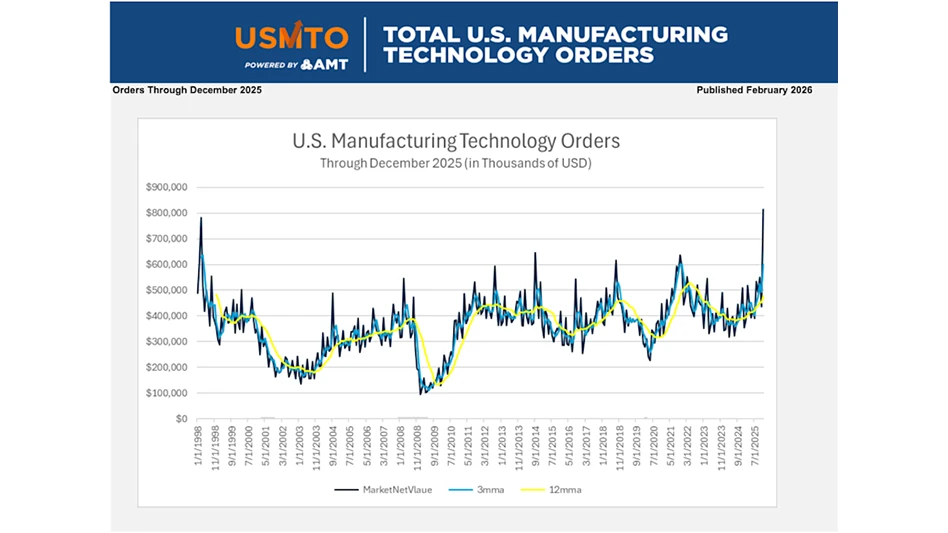
January U.S. manufacturing technology consumption totaled $371.41 million, according to AMTDA, the American Machine Tool Distributors’ Association and AMT - The Association For Manufacturing Technology. This total, as reported by companies participating in the USMTC program, was down 16.3% from December but up 188.3% when compared with the total of $128.82 million reported for January 2010.
These numbers and all data in this report are based on the totals of actual data reported by companies participating in the USMTC program.
“Despite the slight decline in orders from December, the January USMTC report confirms that U.S. manufacturers are reinvesting vigorously to improve productivity,” says Peter Borden, AMTDA president. “As equipment deliveries grow longer and commodity prices increase, factories may continue to make these investments before inflation and other factors raise prices further.”
The United States Manufacturing Technology Consumption (USMTC) report, jointly compiled by the two trade associations representing the production and distribution of manufacturing technology, provides regional and national U.S. consumption data of domestic and imported machine tools and related equipment. Analysis of manufacturing technology consumption provides a reliable leading economic indicator as manufacturing industries invest in capital metalworking equipment to increase capacity and improve productivity.
U.S. manufacturing technology consumption is also reported on a regional basis for five geo-graphic breakdowns of the United States.
Northeast Region
Manufacturing technology consumption in the Northeast Region in January stood at $49.21 million, down 25.6% from December’s $66.13 million but up 92.4% when compared with the January 2010 total.
Southern Region
Southern Region manufacturing technology consumption totaled $53.90 million in January, up 18.7% when compared with December’s $45.42 million and up 96.5% when compared with the total for January 2010.
Midwest Region
At $124.07 million, January manufacturing technology consumption in the Midwest Region was 24.5% lower than December’s $164.32 million but up 224.6% when compared with last January.
Central Region
January manufacturing technology consumption in the Central Region totaled $99.66 million, down 13.1% from December’s $114.68 million but 283.3% higher than the January 2010 total.
Western Region
Western Region manufacturing technology consumption in January stood at $44.58 million, 16.4% lower than December’s $53.30 million but 284.1% higher than the tally for the previous January.
NEED TO KNOW
What is the USMTC Report?
The United States Manufacturing Technology Consumption (USMTC) Report, measures manufacturing technology net new orders every month based on gross order and cancellation data collected from America’s distributors and builders of manufacturing technology. The report provides national U.S. consumption data of domestic and imported machine tools and related equipment, as well as on a regional basis for five geographic breakdowns of the United States. These orders include both domestically produced manufacturing technology and products that have some non-U.S. content, but have some work added domestically. Increases in dollar volume of manufacturing technology orders show that more manufacturing work on the end product is occurring in the U.S.
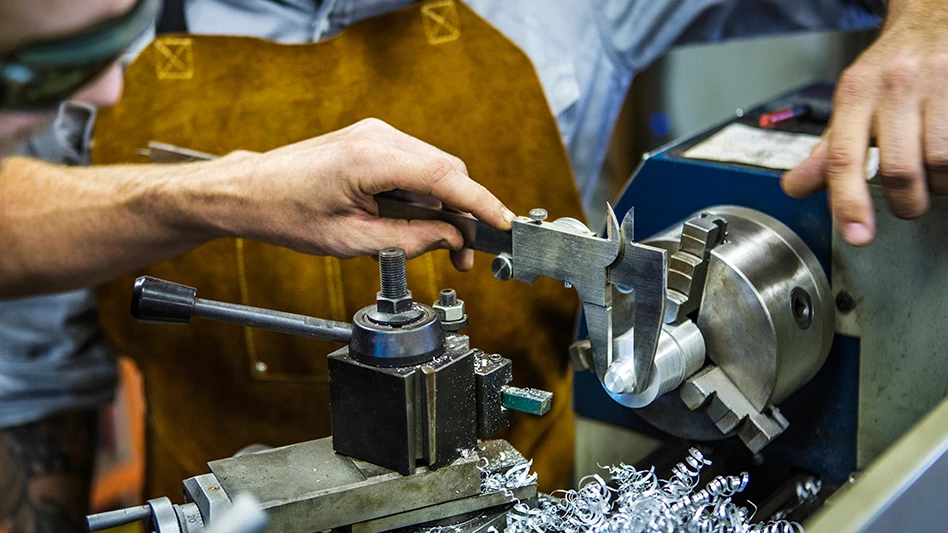
What is Manufacturing Technology?
Manufacturing technology encompasses everything between raw materials and finished product. Manufacturing technology turns raw materials such as steel, iron, plastic, ceramics, composites, and alloys from their original shape as stock materials into what will become durable goods such as airplanes, cars, and appliances we use every day.
Why is the USMTC Important?
Analysis of manufacturing industries investment levels in capital metalworking equipment to increase capacity and improve productivity has historically provided a reliable leading economic indicator for the recovery or softening of America’s industrial base.
Manufacturing technology orders are truly an indication of the vitality of America’s industrial base. Changes in orders are a confirmation of recovery, often establishing an upturn or downturn long before the traditional indicators identify a recovery in full bloom.
By collecting data from distributors and builders are orders reported twice?
Duplications are eliminated using a software program that identifies orders sold to the same customer. Non-U.S. builders who sell into this market are included and the data reported in the USMTC Report represents more than 65% of the U.S. manufacturing technology market and nearly 80% of the market.
Who “owns the USMTC Report?
The report is jointly compiled by AMT – The Association For Manufacturing Technology and the AMTDA – The American Machine Tool Distributors’ Association, both of whom represent the production and distribution of manufacturing technology.
Latest from Today's Medical Developments
- Stryker’s flexible syndesmotic fixation device stabilizes ankle injuries
- Mergers & acquisitions news: MGS, Quantum Surgical bolster medtech portfolios
- Exchangeable-head solid carbide cutting tools
- NextDent 300 MultiJet printer delivers a “Coming of Age for Digital Dentistry” at Evolution Dental Solutions
- Get recognized for bringing manufacturing back to North America
- Adaptive Coolant Flow improves energy efficiency
- VOLTAS opens coworking space for medical device manufacturers
- MEMS accelerometer for medical implants, wearables