United Grinding Technologies (UGT) announces the launch of CAREview Version 1.0, a revolutionary means of equipment and production monitoring. The hope is to have as many as 12 beta sites using the system by year end, 2011. Version 1.0 is focused on monitoring and alerts for the customer and for UGT. The controls for Version 1.0 include Fanuc 0i and Fanuc 31i, which cover Studer, Walter, Blohm, and Mägerle machines.
How it Works
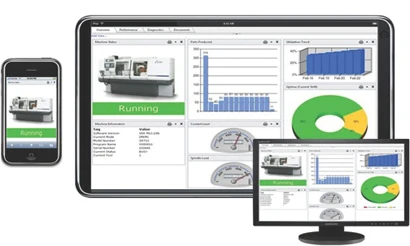
Cloud Computing is described as on-demand access to virtualized IT resources that are housed outside of your own data center. Cloud computing has many advantages, with no longer needing to purchase servers and storage certainly not the least of which. The cloud is even becoming a disaster recovery strategy for many companies. How it works in the case of CAREview is data gets sent from customer machines that are hooked up to the cloud, in turn providing real-time analytics, proactively driving predictive and preventive service, and dramatically decreasing downtime costs and emergency repairs to the equipment. CAREview also features mobile capabilities, resulting in on-demand visibility from anywhere, anytime with a web-enabled device.
“We have a software interface in the machine control that reads addresses that we (UGT) program,” explains Joseph Szenay, GM, United Grinding Customer Care. “These addresses are then sent out to the cloud (actually a huge data farm that’s very much on terra firma). The data farm has an IP address that we assign per machine, per customer. The customer can then log in with any Internet connection using the IP address, and the Dashboard View of his machine will automatically appear via the Internet.”
The Dashboard view shows the customer the real-time activity of his machine: Is it running? Is it in E-stop? Is it idle? Is it making parts? The Dashboard View gives the customer a live snapshot of what his machine is doing. Then should he wish, he can drill down and check a tagged component to see when and if things might have changed. For example, the customer may see that he is only made 454 parts instead the programmed 500 parts. Why the difference? It is possible with CAREview to drill down and see that the operator on third shift, based on the time stamp, turned the feed rate override down 50% for an hour.
“We set the tags on the machine which are part of the Input/Output of the machine,” Szenay explains. “We have a wide range of tags that we can monitor, and the customer can decide which ones he wants to see.”
Benefits
On Version 1.0, a customer will have the Dashboard View. We will be able to see if his machine is running or if it is idle. If it is running parts, we will be able to see how many parts it has run, even how many times the doors open and close. The Production View is for manufacturing engineers (MEs) that run a line of machines. The ME does not have to go out on the shop floor to get machine information; he can be on vacation and pull this up on his iPad and say, “Okay, today they ran 400 parts, and I have had X amount of idle time.”
CAREview is set up so that he can customize the Production Reports so he sees only what he wants to see. He can see if the machine is running or not, and nothing more — if that is what he wants. He can see a graphed chart of the last 24 hours to check how long the machine sat in E-stop, how much it sat idle and how many hours it actually ran. It is specifically tailored for each customer depending on what they want to see.
“We can do customized reports for customers, so they can take any production activity and export into Excel or other forms of output,” Szenay says. “The types of reports they can receive is almost limitless — anything we can see, we can write a report on — for the last year, the last month, the last hour.
“ Generally, the ME is interested in production information. He does not need to see what a grinding spindle, axis motor temperature, or amperage draw is. All he wants to know is how close he is to the X number of parts he needs from this shift and next. Maintenance people want to see trending over time of these other data points, and CAREview can make a complete back up of the control every five minutes, if that is what the customer wants. If the company had a power outage, we have got a backup of up to five minutes before the power went out. They can then pull that data down and reload the machine and be back running in 20 minutes.”
Another area of application is in power consumption reports.
“Our customers on their RFQs are asking questions about power consumption,” Szenay says. The release of Version 2.0 later in the third or fourth quarter of 2011 will address the servomotors, drives and grinding spindles for this purpose.
We can show them which machine components are drawing more than others. We can look at a spindle motor that started out drawing 10 amps and now all of sudden it is drawing 15 amps. What is going on? Real analytics, trending over time and proactive or predictive maintenance will become possible with CAREview.”
Is Cloud Computing Safe?
UGT in Miamisburg, OH, is the controlling hub for all this data activity, and as such they basically decide who can get on the system and who cannot get access.
“The fact is,” Szenay says, “the data that we actually send out at 128 bit encryption is zeros and ones. Nobody would be able to know what those zeros and ones mean. When the zeros and ones hit the data farm, we convert them into what they actually mean. We only send out from the customer machine — we never go back in. We cannot go into the machine from the outside. It only sends out — as encrypted zeros and ones. Even if someone obtained access to the data farm, they still would not know what the data meant.”
Latest from Today's Medical Developments
- NextDent 300 MultiJet printer delivers a “Coming of Age for Digital Dentistry” at Evolution Dental Solutions
- Get recognized for bringing manufacturing back to North America
- Adaptive Coolant Flow improves energy efficiency
- VOLTAS opens coworking space for medical device manufacturers
- MEMS accelerometer for medical implants, wearables
- The compact, complex capabilities of photochemical etching
- Moticont introduces compact, linear voice coil motor
- Manufacturing technology orders reach record high in December 2025