Tempe, Arizona – Economic activity in the manufacturing sector contracted in December for the second consecutive month, while the overall economy grew for the 79th consecutive month, say the nation’s supply executives in the latest Manufacturing ISM Report On Business.
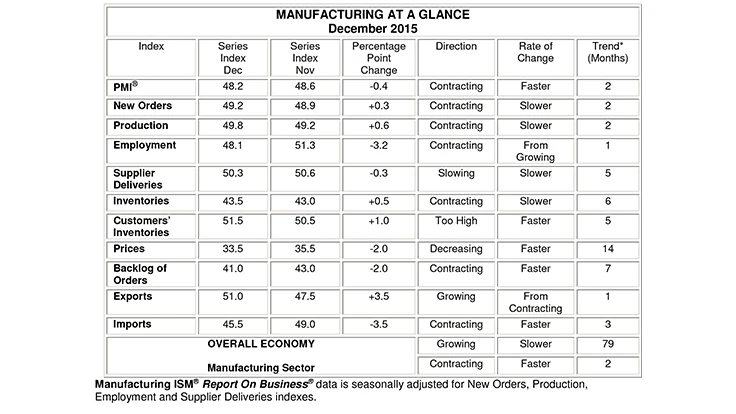
The report was issued by Bradley J. Holcomb, CPSM, CPSD, chair of the Institute for Supply Management (ISM) Manufacturing Business Survey Committee. "The December PMI registered 48.2%, a decrease of 0.4 percentage point from the November reading of 48.6%. The New Orders Index registered 49.2%, an increase of 0.3 percentage point from the reading of 48.9% in November. The Production Index registered 49.8%, 0.6 percentage point higher than the November reading of 49.2%. The Employment Index registered 48.1%, 3.2 percentage points below the November reading of 51.3%. The Prices Index registered 33.5%, a decrease of 2 percentage points from the November reading of 35.5%, indicating lower raw materials prices for the 14th consecutive month. The New Export Orders Index registered 51%, up 3.5 percentage points from the November reading of 47.5% and the Imports Index registered 45.5%, down 3.5 percentage points from the November reading of 49%. As was the case in November, 10 out of 18 manufacturing industries reported contraction in December. Contraction in new orders, production, employment and raw materials inventories accounted for the overall softness in December."
Of the 18 manufacturing industries, six are reporting growth in December in the following order: printing & related support activities; textile mills; paper products; miscellaneous manufacturing; chemical products; and food, beverage & tobacco products. The 10 industries reporting contraction in December — listed in order — are: apparel, leather & allied products; plastics & rubber products; machinery; primary metals; fabricated metal products; transportation equipment; electrical equipment, appliances & components; computer & electronic products; wood products; and nonmetallic mineral products.
What respondents are saying ...
"Low oil prices are negatively impacting oil and gas exploration activities. Low oil prices are generally positive for the petrochemical industry." (Petroleum & coal products)
"Month-over-month sales were down, profitability up." (Chemical products)
"December revenue is flat compared to last month." (Computer & electronic products)
"Still very slow due to oil prices." (Fabricated metal products)
"Deflation in many commodities is helping with product savings. Sales are strong with a backlog." (Transportation equipment)
"Targeting reduced inventories for raw materials by year-end." (Textile mills)
"Sales have dropped and continue to be soft. This is resulting in [a] reduction in workforce and furloughs." (Apparel, leather & allied products)
"Medical device business continues to be strong, both in the U.S. and abroad." (Miscellaneous manufacturing)
"Business is going well. Low fuel prices keep full size SUV and truck sales at high volumes." (Plastics & rubber products)
"Customers are tightening their inventories for year-end, impacting our sales and shipments." (Food, beverage & tobacco products)
December 2015 manufacturing index summaries
Manufacturing contracted in December as the PMI registered 48.2%, a decrease of 0.4 percentage point from the November reading of 48.6%, indicating contraction in manufacturing for the second consecutive month, and is the lowest reading since June 2009 when the PMI registered 45.8%. A reading above 50% indicates that the manufacturing economy is generally expanding; below 50% indicates that it is generally contracting.
A PMI above 43.1%, over a period of time, generally indicates an expansion of the overall economy. Therefore, the December PMI indicates growth for the 79th consecutive month in the overall economy, while indicating contraction in the manufacturing sector. Holcomb stated, "The past relationship between the PMI and the overall economy indicates that the average PMI for January through December (51.4%) corresponds to a 2.6% increase in real gross domestic product (GDP) on an annualized basis. In addition, if the PMI for December (48.2%) is annualized, it corresponds to a 1.6% increase in real GDP annually."
THE LAST 12 MONTHS
| Month | PMI® | Month | PMI® | |
|---|---|---|---|---|
| Dec 2015 | 48.2 | Jun 2015 | 53.5 | |
| Nov 2015 | 48.6 | May 2015 | 52.8 | |
| Oct 2015 | 50.1 | Apr 2015 | 51.5 | |
| Sep 2015 | 50.2 | Mar 2015 | 51.5 | |
| Aug 2015 | 51.1 | Feb 2015 | 52.9 | |
| Jul 2015 | 52.7 | Jan 2015 | 53.5 | |
| Average for 12 months – 51.4 High – 53.5 Low – 48.2 |
||||
New orders
ISM’s New Orders Index registered 49.2% in December, an increase of 0.3 percentage point when compared to the November reading of 48.9%, indicating contraction in new orders for the second consecutive month. A New Orders Index above 52.1%, over time, is generally consistent with an increase in the Census Bureau’s series on manufacturing orders (in constant 2000 dollars).
The seven industries reporting growth in new orders in December – listed in order – are: textile mills; printing & related support activities; miscellaneous manufacturing; petroleum & coal products; primary metals; paper products; and chemical products. The 11 industries reporting a decrease in new orders during December – listed in order – are: wood products; apparel, leather & allied products; plastics & rubber products; electrical equipment, appliances & components; transportation equipment; fabricated metal products; nonmetallic mineral products; furniture & related products; computer & electronic products; machinery; and food, beverage & tobacco products.
| New Orders |
% Better |
% Same |
% Worse |
Net |
Index |
|---|---|---|---|---|---|
| Dec 2015 | 20 | 51 | 29 | -9 | 49.2 |
| Nov 2015 | 22 | 53 | 25 | -3 | 48.9 |
| Oct 2015 | 24 | 53 | 23 | +1 | 52.9 |
| Sep 2015 | 22 | 53 | 25 | -3 | 50.1 |
Production
ISM’s Production Index registered 49.8% in December, which is an increase of 0.6 percentage point when compared to the 49.2% reported in November, indicating contraction in production for the second consecutive month. An index above 51.1%, over time, is generally consistent with an increase in the Federal Reserve Board’s Industrial Production figures.
The seven industries reporting growth in production during the month of December – listed in order – are: printing & related support activities; textile mills; miscellaneous manufacturing; paper products; petroleum & coal products; food, beverage & tobacco products; and chemical products. The nine industries reporting a decrease in production during December – listed in order – are: apparel, leather & allied products; plastics & rubber products; transportation equipment; machinery; computer & electronic products; furniture & related products; electrical equipment, appliances & components; primary metals; and fabricated metal products.
Production |
% Better |
% Same |
% Worse |
Net |
Index |
|---|---|---|---|---|---|
| Dec 2015 | 19 | 54 | 27 | -8 | 49.8 |
| Nov 2015 | 20 | 57 | 23 | -3 | 49.2 |
| Oct 2015 | 23 | 56 | 21 | +2 | 52.9 |
| Sep 2015 | 21 | 59 | 20 | +1 | 51.8 |
Employment
ISM’s Employment Index registered 48.1% in December, which is a decrease of 3.2 percentage points when compared to the 51.3% reported in November, indicating contraction in employment. An Employment Index above 50.6%, over time, is generally consistent with an increase in the Bureau of Labor Statistics (BLS) data on manufacturing employment.
Of the 18 manufacturing industries, in December, the seven industries reporting employment growth – listed in order – are: textile mills; printing & related support activities; paper products; furniture & related products; electrical equipment, appliances & components; chemical products; and miscellaneous manufacturing. The nine industries reporting a decrease in employment in December – listed in order – are: apparel, leather & allied products; petroleum & coal products; primary metals; computer & electronic products; transportation equipment; fabricated metal products; plastics & rubber products; machinery; and food, beverage & tobacco products.
Employment |
% Higher |
% Same |
% Lower |
Net |
Index |
|---|---|---|---|---|---|
| Dec 2015 | 10 | 73 | 17 | -7 | 48.1 |
| Nov 2015 | 15 | 69 | 16 | -1 | 51.3 |
| Oct 2015 | 12 | 68 | 20 | -8 | 47.6 |
| Sep 2015 | 17 | 64 | 19 | -2 | 50.5 |
Supplier deliveries
The delivery performance of suppliers to manufacturing organizations was slower in December as the Supplier Deliveries Index registered 50.3%, which is 0.3 percentage point lower than the 50.6% reported in November. This is the fifth consecutive month of slower supplier deliveries after two months of faster supplier deliveries. A reading below 50% indicates faster deliveries, while a reading above 50% indicates slower deliveries.
The three industries reporting slower supplier deliveries in December are: food, beverage & tobacco products; transportation equipment; and electrical equipment, appliances & components. The five industries reporting faster supplier deliveries during December are: plastics & rubber products; machinery; chemical products; fabricated metal products; and computer & electronic products. Ten industries reported no change in supplier deliveries in December compared to November.
| Supplier Deliveries |
% Slower |
% Same |
% Faster |
Net |
Index |
|---|---|---|---|---|---|
| Dec 2015 | 7 | 84 | 9 | -2 | 50.3 |
| Nov 2015 | 5 | 86 | 9 | -4 | 50.6 |
| Oct 2015 | 5 | 88 | 7 | -2 | 50.4 |
| Sep 2015 | 8 | 84 | 8 | 0 | 50.2 |
Inventories
The Inventories Index registered 43.5% in December, which is 0.5 percentage point higher than the November reading of 43%, indicating raw materials inventories are contracting in December for the sixth consecutive month. An Inventories Index greater than 42.9%, over time, is generally consistent with expansion in the Bureau of Economic Analysis (BEA) figures on overall manufacturing inventories (in chained 2000 dollars).
The five industries reporting higher inventories in December are: petroleum & coal products; furniture & related products; plastics & rubber products; computer & electronic products; and chemical products. The eight industries reporting lower inventories in December – listed in order – are: primary metals; electrical equipment, appliances & components; apparel, leather & allied products; machinery; fabricated metal products; miscellaneous manufacturing; paper products; and transportation equipment.
Inventories |
% Higher |
% Same |
% Lower |
Net |
Index |
|---|---|---|---|---|---|
| Dec 2015 | 14 | 59 | 27 | -13 | 43.5 |
| Nov 2015 | 13 | 60 | 27 | -14 | 43.0 |
| Oct 2015 | 15 | 63 | 22 | -7 | 46.5 |
| Sep 2015 | 20 | 57 | 23 | -3 | 48.5 |
Customers' inventories
ISM’s Customers’ Inventories Index registered 51.5% in December, an increase of 1 percentage point from November when customers’ inventories registered 50.5%. December’s reading indicates that customers’ inventories are considered to be too high for the fifth consecutive month.
The seven manufacturing industries reporting customers’ inventories as being too high during the month of December – listed in order – are: wood products; nonmetallic mineral products; furniture & related products; fabricated metal products; transportation equipment; computer & electronic products; and food, beverage & tobacco products. The four industries reporting customers’ inventories as too low during December are: petroleum & coal products; miscellaneous manufacturing; machinery; and chemical products. six industries reported no change in customer inventories in December compared to November.
| Customers' Inventories |
% Reporting |
%Too High |
%About Right |
%Too Low |
Net |
Index |
|---|---|---|---|---|---|---|
| Dec 2015 | 63 | 18 | 67 | 15 | +3 | 51.5 |
| Nov 2015 | 64 | 16 | 69 | 15 | +1 | 50.5 |
| Oct 2015 | 60 | 15 | 72 | 13 | +2 | 51.0 |
| Sep 2015 | 62 | 19 | 71 | 10 | +9 | 54.5 |
Prices
The ISM Prices Index registered 33.5% in December, which is 2 percentage points lower than in November, indicating a decrease in raw materials prices for the 14th consecutive month. This is the lowest reading since the Prices Index registered 32% in April 2009. In December, 4% of respondents reported paying higher prices, 37% reported paying lower prices, and 59% of supply executives reported paying the same prices as in November. A Prices Index above 52.1%, over time, is generally consistent with an increase in the Bureau of Labor Statistics (BLS) Producer Price Index for Intermediate Materials.
Of the 18 manufacturing industries, no industry reported paying increased prices for their raw materials in December. The 13 industries reporting paying lower prices during the month of December – listed in order – are: primary metals; petroleum & coal products; electrical equipment, appliances & components; machinery; fabricated metal products; apparel, leather & allied products; paper products; transportation equipment; food, beverage & tobacco products; nonmetallic mineral products; chemical products; plastics & rubber products; and computer & electronic products.
Prices |
% Higher |
% Same |
% Lower |
Net |
Index |
|---|---|---|---|---|---|
| Dec 2015 | 4 | 59 | 37 | -33 | 33.5 |
| Nov 2015 | 1 | 69 | 30 | -29 | 35.5 |
| Oct 2015 | 9 | 60 | 31 | -22 | 39.0 |
| Sep 2015 | 6 | 64 | 30 | -24 | 38.0 |
Backlog of orders
ISM’s Backlog of Orders Index registered 41% in December, a decrease of 2 percentage points as compared to the November reading of 43%. Of the 88% of respondents who measure their backlog of orders, 12% reported greater backlogs, 30% reported smaller backlogs, and 58% reported no change from November.
The four industries reporting an increase in order backlogs in December are: textile mills; printing & related support activities; nonmetallic mineral products; and electrical equipment, appliances & components. The 13 industries reporting a decrease in order backlogs during December – listed in order – are: primary metals; wood products; apparel, leather & allied products; fabricated metal products; transportation equipment; plastics & rubber products; paper products; computer & electronic products; furniture & related products; food, beverage & tobacco products; miscellaneous manufacturing; machinery; and chemical products.
| Backlog of Orders |
% Reporting |
% Greater |
% Same |
% Less |
Net |
Index |
|---|---|---|---|---|---|---|
| Dec 2015 | 88 | 12 | 58 | 30 | -18 | 41.0 |
| Nov 2015 | 89 | 15 | 56 | 29 | -14 | 43.0 |
| Oct 2015 | 88 | 13 | 59 | 28 | -15 | 42.5 |
| Sep 2015 | 88 | 13 | 57 | 30 | -17 | 41.5 |
New export orders
ISM’s New Export Orders Index registered 51% in December, which is an increase of 3.5 percentage points when compared to the November reading of 47.5%, and indicates a return to growth in new export orders following six consecutive months of contraction in the New Export Orders index.
The eight industries reporting growth in new export orders in December – listed in order – are: textile mills; printing & related support activities; miscellaneous manufacturing; electrical equipment, appliances & components; fabricated metal products; food, beverage & tobacco products; chemical products; and paper products. The four industries reporting a decrease in new export orders during December are: transportation equipment; computer & electronic products; plastics & rubber products; and primary metals. Six industries reported no change in new export orders in December compared to November.
| New Export Orders |
% Reporting |
% Higher |
% Same |
% Lower |
Net |
Index |
|---|---|---|---|---|---|---|
| Dec 2015 | 78 | 14 | 74 | 12 | +2 | 51.0 |
| Nov 2015 | 79 | 9 | 77 | 14 | -5 | 47.5 |
| Oct 2015 | 75 | 12 | 71 | 17 | -5 | 47.5 |
| Sep 2015 | 75 | 10 | 73 | 17 | -7 | 46.5 |
Imports
ISM’s Imports Index registered 45.5% in December, which is 3.5 percentage points lower than the 49% reported in November, and indicates contraction in imports for the third consecutive month.
The two industries reporting growth in imports during the month of December are: plastics & rubber products; and computer & electronic products. The 11 industries reporting a decrease in imports during December – listed in order – are: primary metals; apparel, leather & allied products; fabricated metal products; miscellaneous manufacturing; furniture & related products; electrical equipment, appliances & components; transportation equipment; food, beverage & tobacco products; machinery; chemical products; and nonmetallic mineral products.
Imports |
% Reporting |
% Higher |
% Same |
% Lower |
Net |
Index |
|---|---|---|---|---|---|---|
| Dec 2015 | 81 | 8 | 75 | 17 | -9 | 45.5 |
| Nov 2015 | 80 | 12 | 74 | 14 | -2 | 49.0 |
| Oct 2015 | 77 | 12 | 70 | 18 | -6 | 47.0 |
| Sep 2015 | 81 | 15 | 71 | 14 | +1 | 50.5 |
Buying policy
Average commitment lead-time for capital expenditures decreased by 8 days to 127 days. Average lead-time for production materials in December decreased by 5 days to 57 days. Average lead time for maintenance, repair and operating (MRO) Supplies decreased by 2 days to 28 days.
| Percent Reporting | |||||||
|---|---|---|---|---|---|---|---|
Capital Expenditures |
Hand- to- Mouth |
30 Days |
60 Days |
90 Days |
6 Months |
1 Year+ |
Average Days |
| Dec 2015 | 23 | 9 | 12 | 15 | 25 | 16 | 127 |
| Nov 2015 | 21 | 6 | 12 | 19 | 24 | 18 | 135 |
| Oct 2015 | 25 | 8 | 13 | 18 | 21 | 15 | 119 |
| Sep 2015 | 25 | 7 | 10 | 17 | 22 | 19 | 133 |
Production Materials |
Hand- to- Mouth |
30 Days |
60 Days |
90 Days |
6 Months |
1 Year+ |
Average Days |
| Dec 2015 | 15 | 39 | 24 | 14 | 6 | 2 | 57 |
| Nov 2015 | 13 | 39 | 25 | 14 | 6 | 3 | 62 |
| Oct 2015 | 15 | 38 | 24 | 14 | 5 | 4 | 63 |
| Sep 2015 | 12 | 43 | 20 | 14 | 8 | 3 | 63 |
MRO Supplies |
Hand- to- Mouth |
30 Days |
60 Days |
90 Days |
6 Months |
1 Year+ |
Average Days |
| Dec 2015 | 42 | 36 | 17 | 5 | 0 | 0 | 28 |
| Nov 2015 | 35 | 41 | 20 | 4 | 0 | 0 | 30 |
| Oct 2015 | 39 | 41 | 14 | 6 | 0 | 0 | 28 |
| Sep 2015 | 40 | 37 | 17 | 5 | 1 | 0 | 30 |
Source: Manufacturing ISM® Report On Business®
Latest from Today's Medical Developments
- Gore completes acquisition of Conformal Medical
- Medical textiles designed for cardiovascular, orthopedic, dental prosthetic applications
- Micro-precision 3D printing: Trends and breakthroughs in medical device manufacturing
- One-component, dual-cure adhesive system for medical device assembly
- #82 Manufacturing Matters - Forecasting 2026 with GIE Media's Manufacturing Group
- Flexing prosthetic finger offers lifelike appearance and movement
- How the fast-evolving defense market impacts suppliers
- Medtronic’s Hugo robotic-assisted surgery system makes US debut